Josipa Pavic1, Désirée Coen Herak2, Marija Milos2, Renata Zadro2,3
1Department of Medical Biochemistry and Haematology Laboratory, General County Hospital Livno, Livno, Bosnia and Herzegovina; 2Department of Laboratory Diagnostics, University Hospital Centre Zagreb, Zagreb, Croatia; 3University of Zagreb, Faculty of Pharmacy and Biochemistry, Zagreb, Croatia
BACKGROUND
Specific shapes and slopes of the aPTT reaction curve are characteristic for patients with congenital or acquired FVIII/FIX deficiency. Questionable aPTT results are flagged by the analyzer and should be visually inspected.
AIMS
To investigate the possibility to detect the presence of FVIII/FIX inhibitors by analyzing flagged aPTT results after visual inspection of reaction curves and manual measurement of the reaction curve angle (RCA).
PATIENTS
- 131 patient plasma samples with request for the determination of FVIII/FIX inhibitors
- Patients were divided into two groups:
GROUP I – 103 patient without inhibitors
GROUP II – 28 patient with inhibitors (inhibitor titer : 0.66-31.30 NBU/ml)
METHODS
aPTT was performed using Actin FS on Atellica COAG 360 (Siemens, Germany) at 405 nm with manufacturer’s proposed evaluation method DRIFTING BASELINE (DB) and checking method ANGLE DB that flagged aPTT results with RCA<30 degrees.
All aPTT reaction curves were visually inspected and RCA were manually measured.
FVIII and FIX activities were determined by one-stage clotting assay.
Inhibitor titers were determined using Nijmegen modified Bethesda assay.
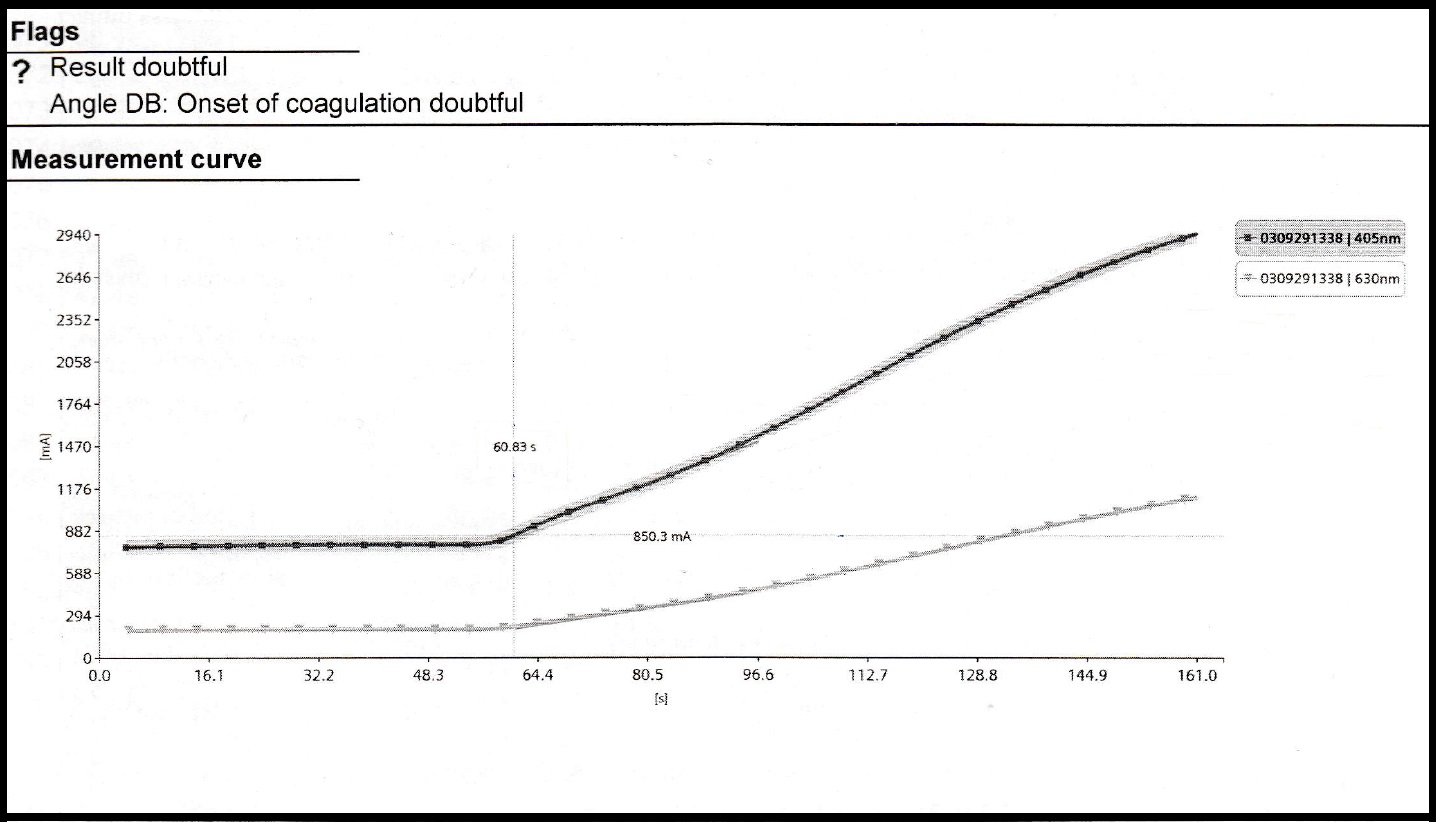
Figure 1. aPTT 405 nm reaction curve of a patient with FVIII inhibitor
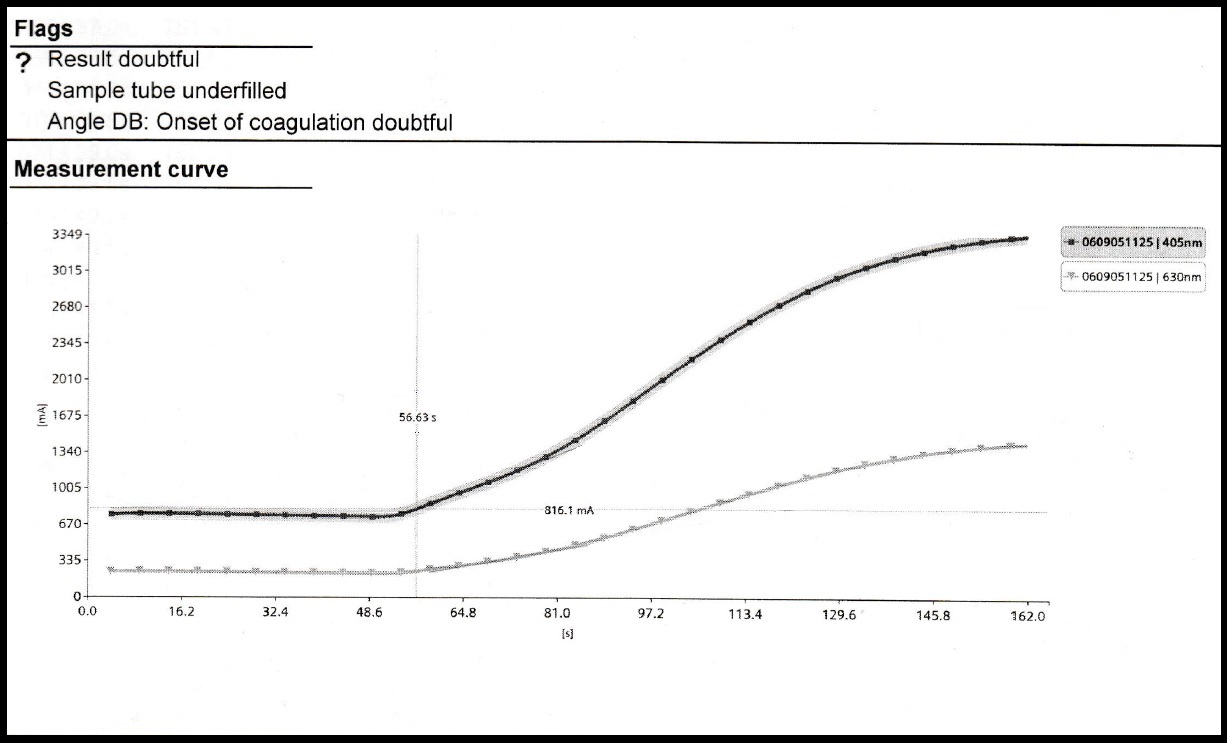
Figure2. aPTT 405 nm reaction curve of a patient without FVIII inhibitor
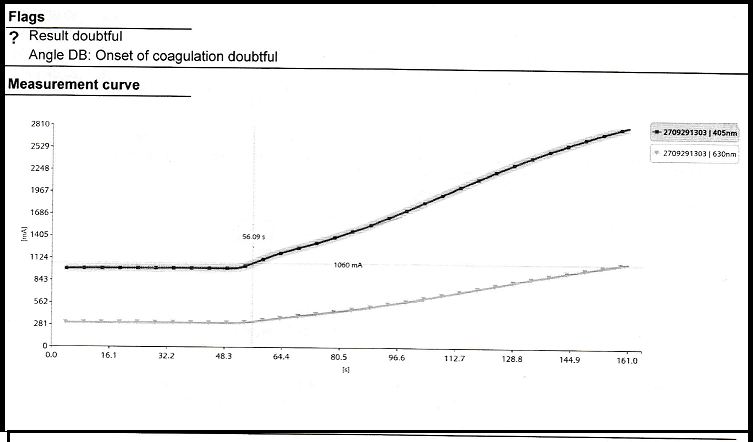
Figure 3. aPTT 405 nm reaction curve of a patient with FIX inhibitor

Figure 4. aPTT 405 nm reaction curve of a patient without FIX inhibitor
RESULTS
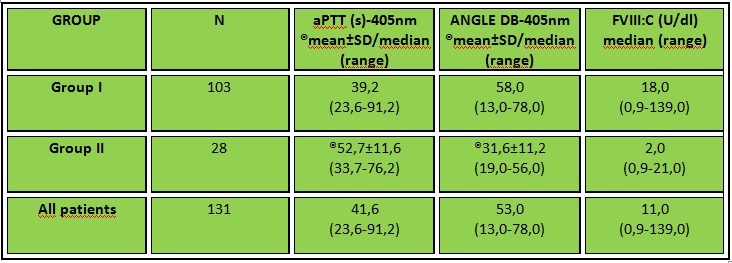
Table 1. Results of investigated parameters in selected groups and all patient samples
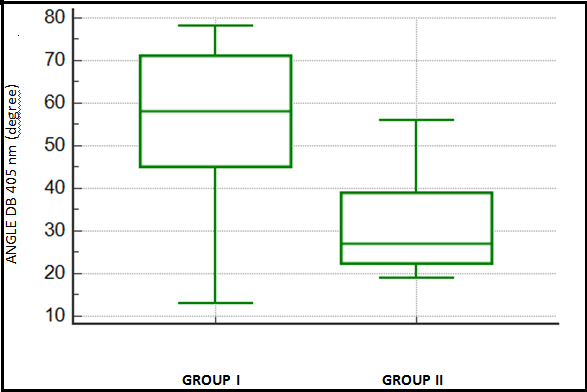
Figure 5. Data comparison graph of results for angle DB 405 nm in patient without (Group I) and with inhibitors (Group II)
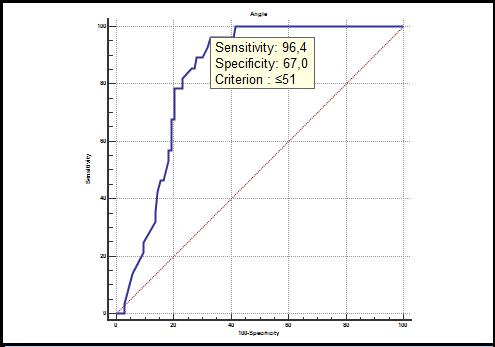
Figure 6. ROC curve analysis for distinguishing between patients with and without inhibitors
(∗predefined RCA of 30 degrees showed the sensitivity of 57.1% and specificity of 81.6%)
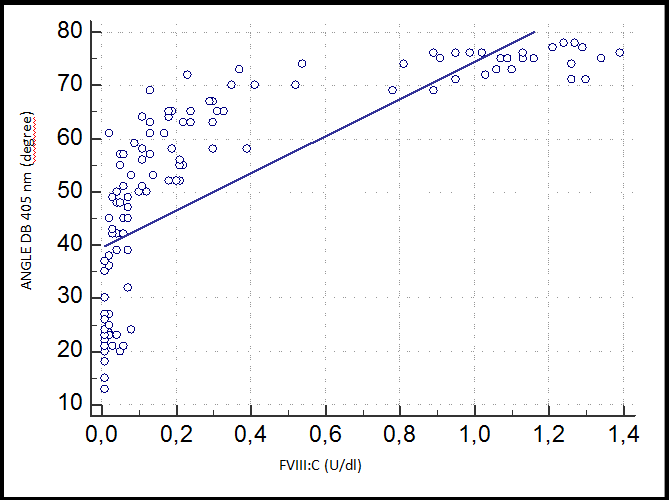
Figure 7. Correlation of FVIII activity results and angle DB 405 nm in all tested patients ( r=0.932; P<0.001 )
CONCLUSIONS
Based on obtained results, it may be concluded that ANGLE DB checking method, together with visual inspection of aPTT reaction curve and angle measurement, provides a simple and reliable tool to screen for the presence of FVIII/FIX inhibitors.
